Headlines
- A Global Oil and Food Crisis Looms – The Countdown to the End of September
- What Happened Behind the COVID-19 Pandemic? The Truth Behind the Indictment of Four Chinese Container Manufacturers
- Mastermind or Victim? The Real Cause Behind the Surge in Container Prices
- Up to 12.5% Additional Duties on Japan? Rising Interest Rate Pressures in the U.S. and Europe Amid Weak Demand in China
- Will June Mark the Peak of Import Demand? Alternative Routes to Prepare for Another Freight Rate Surge
- Cooling Demand from Manufacturers Holding 96% Market Share? – Newly Built Container Information in June
A Global Oil and Food Crisis Looms – The Countdown to the End of September

In response to the prolonged closure of the Strait of Hormuz, the Food and Agriculture Organization of the United Nations (FAO) has warned that the world could face a severe food price crisis over the next six to twelve months. The organization has specifically pointed out that some developing countries in Asia, Africa, and Latin America that rely heavily on imports of nitrogen-based fertilizers from the Middle East may face a risk of sharp increases in food prices.
According to the Baltic and International Maritime Council (BIMCO), a de facto three-month closure of the Strait of Hormuz would reduce crude oil and product tanker transportation volumes by 13% year-on-year. To offset the resulting shortage of crude oil supplies, global petroleum reserves are already being released at a record pace. BIMCO further warns that, under the worst-case scenario in which the Strait of Hormuz remains closed through 2027, global oil inventories could fall to critically low levels by the end of September this year.
President Donald Trump is believed to be eager to reach an agreement with Iran as quickly as possible. By lowering domestic gasoline prices ahead of the summer vacation season, when Americans traditionally travel extensively by car, he would strengthen his position ahead of the November midterm elections. At the same time, Iran, whose economy remains heavily dependent on oil exports, undoubtedly wishes to accelerate its economic recovery through the resumption of oil sales. Moreover, the prompt reopening of the Strait of Hormuz is a matter of vital importance for countries that rely on Iranian crude oil imports. The reopening of the Strait of Hormuz is now a matter of urgency and can no longer be postponed.
What Happened Behind the COVID-19 Pandemic? The Truth Behind the Indictment of Four Chinese Container Manufacturers
On May 19, news broke that the U.S. Department of Justice had indicted four major Chinese container manufacturers and seven executives for alleged violations of the Sherman Antitrust Act. The indictment alleges that the companies conspired to restrict the production of DRY containers and artificially inflate prices during the period from November 2019 through January 2024.
Following the outbreak of COVID-19 in Wuhan, China, in January 2020, countries around the world spent much of 2020 and 2021 implementing measures to contain the spread of the virus. During this period, the Chinese government adopted its strict “Zero-COVID” policy, aimed at completely suppressing infections through extensive quarantine and movement restrictions. As part of this policy, Shanghai underwent a full citywide lockdown for more than two months, from March 28 until restrictions were lifted on June 1, 2022. The Zero-COVID policy ultimately came to an end in January 2023. Notably, the period covered by the alleged antitrust violations coincides almost entirely with the years of the COVID-19 pandemic.
In the United States, they experienced two extraordinary waves of consumer demand. The first was the “stay-at-home demand” generated by business restrictions and lockdown measures imposed between March and May 2020. The second was the so-called “revenge demand” that emerged from mid-2021 onward, as consumers resumed purchases of furniture, household appliances, clothing, and other goods following the easing of travel and dining restrictions.
As a result, an unprecedented volume of import containers was shipped from China to the U.S. West Coast, particularly to the Ports of Los Angeles and Long Beach, during the second half of 2021. Severe shortages of truck drivers and chassis significantly reduced port handling efficiency, causing widespread congestion throughout the supply chain. By January 2022, more than 100 containerships were reported waiting at anchor off the U.S. West Coast. The period of the alleged antitrust violations also overlaps with this extraordinary disruption in global logistics.
Container shipping lines were unable to reposition empty containers efficiently from North America and other regions around the world, leaving them with little choice but to rely on newly manufactured containers from Chinese manufacturers. What ultimately helped avert the worst-case scenario was the millions of containers that leasing companies had ordered speculatively and kept in reserve. Shipping lines undoubtedly placed orders as well, but during the pandemic they were largely occupied with securing and operating vessels, while also managing the efficient utilization of containers moving across the globe. As a result, placing large-scale orders for new containers was likely not their highest priority.
Mastermind or Victim? The Real Cause Behind the Surge in Container Prices
In reality, if the alleged collusion among Chinese container manufacturers were deemed to violate antitrust laws, one could argue that the manufacturers themselves would be the first victims. The primary reason is that the unprecedented rise in container prices during this period was largely attributable to soaring steel prices rather than any artificial manipulation of the market.
While I do not intend to defend the container manufacturers, it is worth noting that Chinese steel producers account for approximately 50% of global crude steel production, producing more than one billion tons annually. Much like China’s shipbuilding industry, Chinese container manufacturers are highly competitive enterprises that utilize this steel to produce export products and generate valuable foreign exchange earnings for the country. For this reason, each of China’s four major container manufacturers maintains container factories in three regions—Dalian in the north, the Shanghai area, and Guangzhou in the south. They compete with one another for orders and make continuous efforts to keep their production lines running at full capacity. In addition, container manufacturers continue to invest heavily in new factories and state-of-the-art production equipment to improve manufacturing efficiency. Their facilities are designed to operate flexibly under two- or three-shift production systems, enabling them to quickly adjust output in response to market demand while maximizing productivity.
Container prices rose from $1,620 per 20f in November 2019 to a record high of $4,000 per 20f in June 2021, before declining to $2,100 per 20f by January 2024. In other words, prices increased from $1,620 to their peak of $4,000 over a period of approximately one and half years and then gradually eased back to $2,100. Although the difference between the lowest and highest price levels amounted to approximately 2.5 times, such a fluctuation may not be considered extraordinary when viewed in the context of the unprecedented market disruptions caused by the COVID-19 pandemic.
Shipping lines and container leasing companies routinely negotiate prices with container manufacturers, openly discussing order volumes and even comparing quotations from competing manufacturers in order to secure better terms. Even within the same manufacturing group, prices may vary depending on the factory location, logistical advantages, and the timing of negotiation. In this sense, Chinese container manufacturers can be regarded as reasonably fair market participants.
During the COVID-19 pandemic, container leasing companies and shipping lines continued to place orders with container manufacturers and supplied containers to cargo owners, helping to alleviate disruptions in global supply chains and ensuring that the needs of end consumers were met. As a result, while container manufacturers and leasing companies also benefited, it goes without saying that shipping lines in particular generated historically high profits between 2020 and 2025.
It should also be noted that, the four major container manufacturers fully transitioned from oil-based to water-based coatings in accordance with Chinese government policy beginning in April 2017.To facilitate this change, they invested in new production equipment and proactively adapted to increasingly stringent environmental regulations.
Up to 12.5% Additional Duties on Japan? Rising Interest Rate Pressures in the U.S. and Europe Amid Weak Demand in China
According to the U.S. employment report for May released by the Department of Labor on June 5, nonfarm payroll employment increased by 172,000 from the previous month, significantly exceeding market expectations. The unemployment rate remained unchanged at 4.3%, indicating that labor market conditions remain stable. In order to prevent inflation from remaining elevated, the Federal Reserve (FRB) has signaled the possibility of an interest rate hike at its next policy meeting.
The U.S. Supreme Court ruled that the reciprocal tariffs and fentanyl-related tariffs imposed under the International Emergency Economic Powers Act (IEEPA) were unconstitutional. In response, President Donald Trump introduced a new 10% tariff on imports from all countries for a period of 150 days beginning on February 24, pursuant to Section 122 of the Trade Act of 1974. As this measure is scheduled to expire in July, the Office of the United States Trade Representative (USTR) announced on June 2 a proposal to impose additional tariffs of up to 12.5% on imports from 60 countries and regions, including Japan, citing insufficient measures to prevent the importation of goods produced through forced labor. The timing of the implementation has not yet been announced.
According to the preliminary estimate released by Eurostat on June 2, consumer prices in the Eurozone rose 3.2% year-on-year in May. Energy prices have remained elevated amid ongoing instability in the Middle East. The inflation rate increased from 3.0% in April, reaching its highest level since September 2023.
Meanwhile, the Manufacturing Purchasing Managers’ Index (PMI) for May, released by China’s National Bureau of Statistics on May 31, stood at exactly 50.0, the threshold separating expansion from contraction. The index declined by 0.3 points from the previous month, marking the second consecutive month of deterioration. According to the Bureau, persistent weakness in demand remains the primary factor preventing a stronger improvement in business sentiment.
Will June Mark the Peak of Import Demand? Alternative Routes to Prepare for Another Freight Rate Surge
According to the National Retail Federation (NRF), U.S. retail-related container imports totaled 2.05 million TEU in April, falling short of the previous forecast by 80,000 TEU. Imports are projected to reach 2.14 million TEU in May, up 30,000 TEU from the previous forecast, and 2.25 million TEU in June, an upward revision of 120,000 TEU. July imports are forecast at 2.19 million TEU, down 10,000 TEU from the previous estimate, while August is projected at 2.12 million TEU, down 70,000 TEU. September imports are expected to reach 2.06 million TEU, a decrease of 20,000 TEU from the prior forecast, while October imports are projected at 2.08 million TEU, representing a marginal increase of 0.1%. June is expected to mark the peak of container import demand this year.
According to Container Trades Statistics (CTS) of the United Kingdom, global container throughput reached 16.242 million TEU in April 2026, up 4.0% from the previous month and 1.6% year-on-year. Cumulative volume for the January–April period totaled 63.85 million TEU, exceeding the level recorded during the same period last year by 5%. As the second quarter (April–June) got underway, the Gulf crisis began to exert an immediate and significant impact on freight rates. Despite these challenges, global container trade continues to demonstrate remarkable resilience. This trend has been particularly evident in Sub-Saharan Africa, which has emerged as one of the strongest-performing regions in the world. CTS noted that exports from the region increased by 10% and imports by 15% during the January–April period, highlighting the growing role of alternative trade routes and emerging markets in supporting global trade growth.
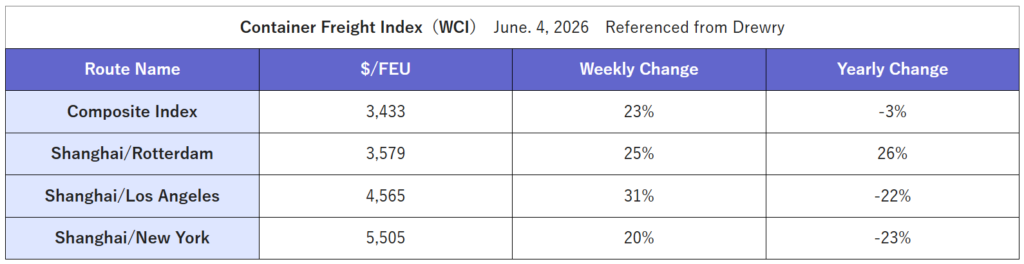
Drewry believes that the earlier-than-usual start of this year’s peak season has supported both strong demand and rising spot freight rates. The firm also notes that carriers have successfully implemented Peak Season Surcharges (PSS) on North America-bound cargoes from June. As the industry enters the traditional peak shipping season and seasonal demand continues to strengthen, Drewry expects further upward pressure on freight rates over the coming weeks.
According to Drewry’s Cancelled Sailing Tracker released on June 5, the blank sailing rate on the major East–West trade lanes is 5% for the five-week period from Week 24 (June 8–14) through Week 28 (July 6–12). This represents a decline of two percentage points from the previous week. Of the total blank sailings, 49% are on the eastbound Trans-Pacific trade, while 33% are on the Asia–Europe and Mediterranean trade routes.
According to the China Container Industry Association (CCIA), China’s total container production in 2025 reached approximately 6.45 million TEU, representing a decline of 24.4% compared with 2024. Nevertheless, annual production exceeded 6 million TEU for only the third time in history, following 2021 and 2024. China continues to account for more than 96% of global container production.
CCIA forecasts China’s container production for 2026 at between 4.5 million and 5.0 million TEU. The outlook reflects several factors, including slower-than-expected growth in global trade, uncertainty surrounding the resumption of normal vessel transits through the Red Sea, insufficient container demand, and a reduced sense of urgency among leasing companies and shipping lines to place orders for new containers. As a result, demand for newbuild containers is expected to remain subdued.
At the same time, intense price competition among container manufacturers is placing pressure on profit margins. With labor, coatings, steel, and environmental compliance costs expected to continue rising, CCIA emphasizes that manufacturers will need to enhance production efficiency through digitalization and other technological initiatives in order to strengthen their competitiveness.
The price of a newbuild dry container in May remained unchanged from the previous month at $1,750 per 20f. It appears that higher steel prices were offset by lower flooring material costs, allowing manufacturers to maintain the same pricing level as in April.
New container production in May totaled 590,468 TEU (Dry: 552,329 TEU; Reefer: 38,139 TEU). Compared with the previous month, production increased by 14,991 TEU (Dry: +20,316 TEU; Reefer: -5,325 TEU). Dry container production increased while reefer container production declined, reflecting a typical demand-driven production pattern. On a percentage basis, total production increased by 2.6% (Dry: +3.8%; Reefer: -12.3%).
While the closure of the Strait of Hormuz has undoubtedly had an impact, the latest production figures suggest that global economic activity is beginning to gain momentum ahead of the summer peak season. As of the end of May, factory inventories of new containers stood at 1,555,846 TEU (Dry: 1,497,632 TEU; Reefer: 58,214 TEU). Compared with April, total inventories increased by 26,831 TEU (Dry: +24,813 TEU; Reefer: +2,018 TEU), representing an increase of 1.8% overall (Dry: +1.7%; Reefer: +3.6%). Factory deliveries in May totaled 563,637 TEU (Dry: 527,516 TEU; Reefer: 36,121 TEU). Compared with the previous month, total deliveries increased by 52,470 TEU (Dry: +56,415 TEU; Reefer: -2,945 TEU), representing an increase of 10.3% overall (Dry: +12.0%; Reefer: -9.8%). These figures indicate that shipments of dry containers increased significantly compared with the previous month.